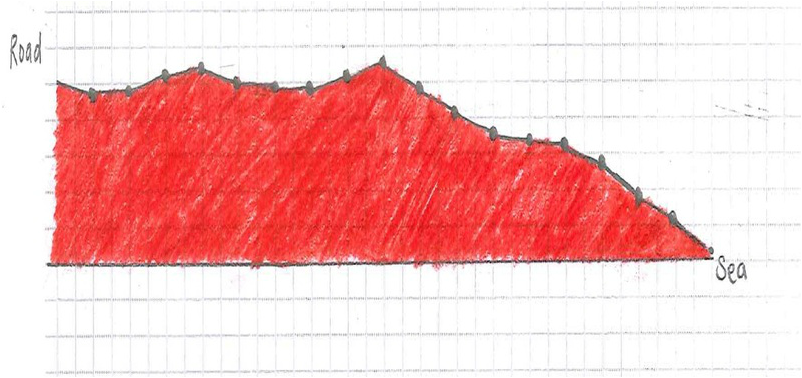
Below are the information that we have collected at the beach showing the shape of the shoreline. There are total of 8 groups, consisting 6 people a group to finish this activity. We are assigned to different areas and had used the inclinometer to measure the inconsistency of the shoreline. Each group has to start measuring from the road and eventually get the finish when it reaches the sea.
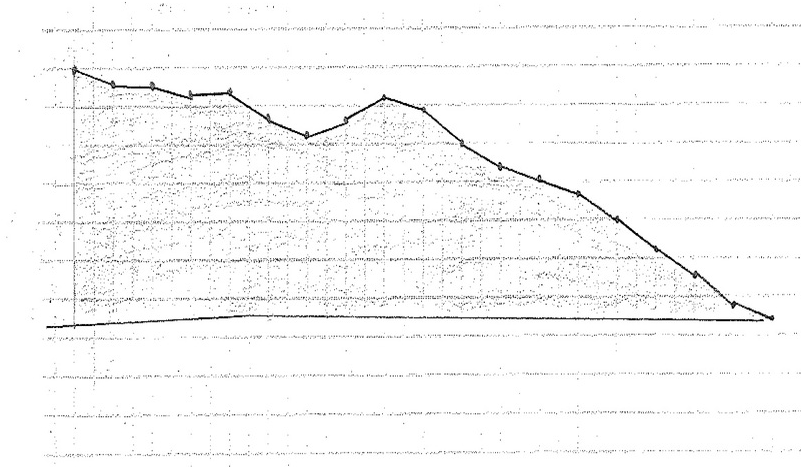
Group 1
Above is the data collected by group one. As you can see, it started off flat but there was a slight drop at 2m and regained itself at 6m. The reason that had lead to this is not certain as many situations can be implied. For example, it can be because a child coincidentally took some sand away to build sandcastles or students from our school were shovelling some sands using their feet. After the small slope, the land is considered to be quite even until it reached 28m and it started to go up. The reason for this could be because the sands are usually blown to this particular direction which eventually had formed a little mound. The land soon started to slide as it got closer to the sea because the waves washed the sand away due to long shore drift.
Group 2

The graph shows that the land was flat in the beginning and gradually went up. Reasons such as wind erosion or too many human interaction/activities would cause this to happen. The little mound eventually went back to a flat surface but started to slide again as it got closer to the sea. It started to form a slope as long shore drift is happening in this area. In my opinion, i don't think there is a big difference between this graph and the previous one as the distance between two groups are not too far.
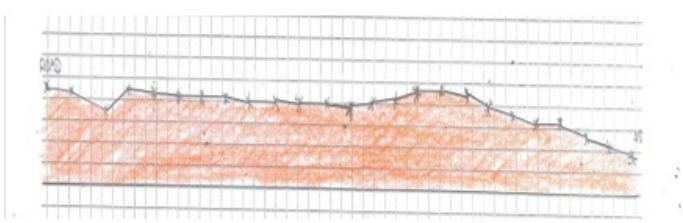
Group 3
In this group's beach profile, the beginning was flat just like other graphs. However, the lines started to go up and down reflecting that land was filled with uneven sands in the next few meters. This has shown that there are more human interaction/activities going on in this area. The examples that i remember seeing at Pantai Morib was people riding bikes and running around flying kites. There were also some mamak stalls nearby which often attract the tourists. This could result in the bump and hump as sands would be carried to somewhere else with the shoes. In 28 meters, it had formed a small peak as the sands from sea could be washed up. As for the slide, long shore drift would be the reason as it carries the sand away from a lower ground making the sands becoming less. Compared to the previous graphs, i would conclude that the wear away of sand was more serious here as there were stronger waves hitting the shoreline.
Group 4
Group 4's graphs is probably the most even out of all the graphs at the starting point. The reasons that have led to this result could be because this area has the least tourist. Therefore, the graph is showing a straight line meaning that the sand was consistent here. However, it started to form a slight drop when it reached 22 m. As we go further, the sands resulted to be lesser as it got closer to the sea. The most likely reason to have led to this is long shore drift carrying sands away.
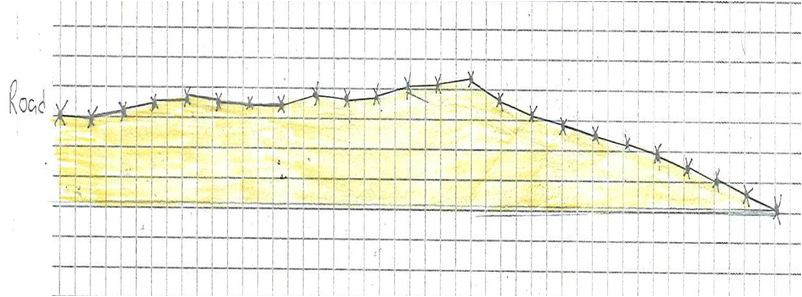
Group 5
This data was collected from the area near the mangroves swamp at Pantai Morib. As we can see, there is a back slope right from the starting point. This is most probably because of human interaction/activities. People can be doing activities like walking on the beach or even riding motorbikes which led to erosion. It later gradually moved up and reached its peak at 18m, the cause of it is unknown but there is possibility that it is a storm beach where the sand was thrown up to the coast by storm. Another possible reason could be the wind wearing the sands from the starting point and landed on 18 m. Later, it went into a slope again and was consistent for 2m and started to drop as it got closer to the sea. This can be a result of long shore drift.
Group 6
This data is collected by Group 6 at the north side of Pantai Morib. As we can see, It is more high rise than the previous data collected by group 1-4 which means it has more sands than other areas. The could be the data was collected at North side of the beach. Long shore drift carries sands from the south to the north and that explains why the data in the beginning had less sands when it went towards the sea. Another reason can be because there is less human interaction and therefore there were more sediment than other areas.
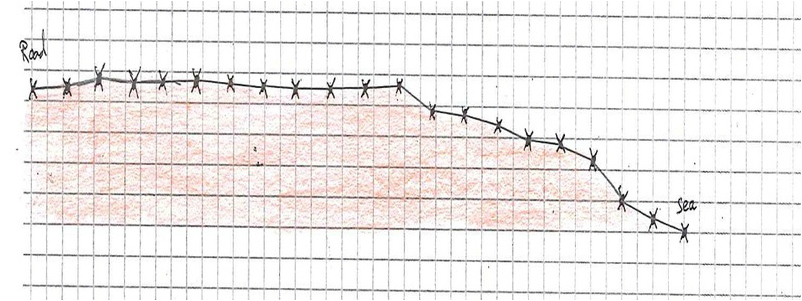
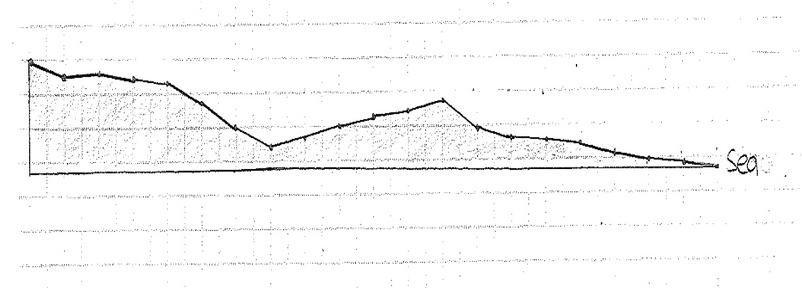
Group 7
This data from group 7 doenst have a huge different compared to group 6 as the pattern is quite similar. In the beginning, it started to have a slight slide and some bump and hump and eventually formed a small peak/mound when it reached 16 m. This peak again can be a sign of storm beach. As for the reasons for the small bump, it would be either human interactions or the sands were being worn away. This can also be a possible reason why there was a peak/mound. From 18 m, it started to slide and showed some consistency as it reached the sea. Again, this data has shown that there was less human interaction in this area because there is a higher rise of sentiment compared to other data collected.
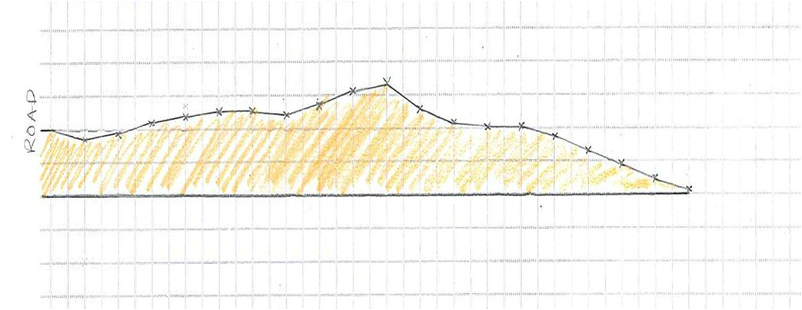
Group 8
This is the eighth data, collected at furthest right of Pantai Morib where Mangroves are around. This data is considered to be the most interesting one as the pattern has a huge difference compared to the previous ones. Instead of having more sands that are carried from the south, it resulted to have less sediment. Besides, it also shows that this area has a really uneven surfaces. This profile started off having a small slide in the beginning and dramatic fall when it reached 8 m which was considered to be quite steep. A reason for this would be human interaction like covering a person's body with the sand dug out. This would explain why there is a valley like formation at 14 m. Gradually, the sands started to go up and formed a small mound which shows a high possibility of storm beach. Lastly, i would like to point out the presence of the mangroves plants. Another reason why this data looks different because there are mangroves in this area.
Conclusion
From the data collected, i would categorized groups 1-4 as the areas that have most human interactions/activities, long shore drift and erosion happening. If you refer to group 1-4, you will see that the beginning is not flat and that's a result of human interaction/activities. Also perhaps of long shore drift that caused such a formation as can be seen from the above data. Besides, it also shows the long shore drift takes place from the South side of the beach as the North side has more sand.
